DACF Home → Bureaus & Programs → Maine Geological Survey → Hazards → Coastal Structure and Dune Crest Inventory and Overtopping Potential → FAQ
Coastal Structure and Dune Crest Inventory and Overtopping Potential - Frequently Asked Questions
- Q1. How do I use this viewer?
- Q2. What data is visualized in this viewer?
- Q3. What datasets were used to compile this information?
- Q4. Are there any quick data summaries you can share?
- Q5. I’d like to see how my county is represented in this data. Could you break down statistics by county?
Q1. How do I use this viewer? Back
To use the viewer, either zoom in on the map to your area of interest, either manually click the  keys on the left of the viewer tab), or by typing in an address or place and hitting the search tab
  . You can also zoom in or out by using the scrolling wheel on your mouse, if you have one. You can convert the Viewer into Full Screen mode by clicking on “View Map Full Screen” tab directly below the viewer home page.
To turn certain specific data layers on or off, simply click the data layers tab  and place a checkmark in the appropriate data layers you want to view.
When zooming, available data layers will automatically zoom with you. In the far-away view (outside of a certain scale), the viewer will only display line features for dune crests and coastal engineering structures. At a certain scale, the viewer will add point features representing the elevations of the structures and dune crests in reference to the FEMA BFEs, along with additional information. Once inside a certain scale, the viewer will only show the point features (the line features will stop drawing). To get more information on a feature (such as a line or point), simply click on that feature to extract information as described below in What data is visualized in this viewer?
Data descriptions, data disclaimers, and frequently asked questions are also available on the webpage below the viewer.
Q2. What data is visualized in this viewer? Back
Several different features are visualized, including line features that represent coastal engineering structures (rip-rap, bulkheads, etc.) and dune crests, and point features representing comparisons between preliminary FEMA BFEs and the crest elevations of engineering structures or dunes.
Line Feature Classes
Structures Lines – a black line representing the digitized linear extent of coastal engineering structures, including rip-rap seawalls, bulkheads, jetties, breakwaters, geotubes, etc. for each of Maine’s coastal counties (from south to north, York, Cumberland, Sagadahoc, Lincoln, Knox, Waldo, Hancock and Washington). Note that in some cases there can be more than one line of structures along a section of shoreline, and that a structure may be seaward (or landward) of a dune crest. If you click on the structures line, attributes include:
- Structure_Type – For Kittery to Cape Elizabeth, this attribute describes the immediate seaward habitat type (e.g. bedrock, mudflat, marsh, beach, dune, etc. if determined in the analysis), followed by the landward shoreline structure type (rip-rap or bulkhead), separated by a forward slash (e.g., beach/rip-rap). For South Portland east to Perry, this only includes the shoreline structure type. Note that the structure type and habitat was developed at the time of data analysis and may not reflect current conditions.
- HAT_Contact – whether it appears that the highest astronomical tide and/or water action is in contact with the structure (qualified by a Y, N). Note that HAT_Contact is dependent upon the topography at the time of the LiDAR data collection and may not reflect current conditions. Note that HAT_Contact was not determined for any areas east of Phippsburg.
- Town – the municipality in which the structure is located.
- County – the county in which the structure is located.
- Dist_mi – the measured distance of the structure, in miles, at the time of mapping.
Dune Crest Lines – a dashed light green line representing the digitized linear extent of the crest of primary undeveloped (with armoring structures) coastal sand dune crests in coastal communities. Note that in some cases there can be more than one dune crest along a section of shoreline, or a dune may be seaward (or landward) of a coastal engineering structure. Note that mapped dune crests change as additional data is available, so this may not represent all sand dunes in Maine. If you click on the line, attributes include:
- Dune Type – whether not a dune (0), a frontal dune (1), or a back dune (2). Note that dunes change over time and the mapped dune crest is dependent upon the topography at the time of analysis and many not reflect current conditions.
- Dist_mi – the distance of the dune crest, in miles.
- Town – the municipality in which the structure is located.
- County – the county in which the structure is located.
Point Feature Classes
Structures Points – a color-coded point file representing points (approximately 5-meter spacing) along the digitized structure line where elevations were extracted from available LiDAR data and compared with available FEMA 100-year BFE values. The data is symbolized by color-coded squares which represent the relationship between the engineering structure elevation and the FEMA BFE. Yellow to red colors indicate that the approximate crest of the coastal engineering structure is below the FEMA BFE, while light to dark shades of green indicate that the crest of the coastal engineering structure is at or above the FEMA BFE. Coloring and scaling is as follows:
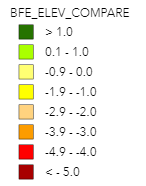
If you click on an individual structure point, attributes include:
- STRUCTURE1 – description of the seaward-most shoreline engineering structure, if appropriate – only for Kittery to western Phippsburg, not available for the rest of the coast.
- STRUCTURE2 – description of the landward-most shoreline engineering structure, if appropriate – only for Kittery to western Phippsburg, not available for the rest of the coast.
- STRUCTURE_TYPE – description of the shoreline engineering structure, if appropriate – for all shorelines east of Phippsburg.
- FLD_ZONE – the mapped FEMA flood zone in which the point falls, either A, AE, AO, VE, or OPEN WATER.
- STATIC_BFE – the effective FEMA base flood elevation referenced to feet, NAVD88; if no published value, -9999 is used.
- DEPTH – if the point is in a FEMA mapped AO zone, the published flood depth (1, 2, or 3 feet).
- Elev_ft – the elevation, in feet NAVD88, of the crest of the shoreline engineering structure.
- BFE_ELEV_COMPARE – comparison between BFE and the engineering structure’s approximate crest elevation. A negative value indicates the structure is below the BFE.
- NEAR_FLD_ZONE – if the point is not in a flood zone, the nearest flood zone to the point. Blank if the point is within a mapped flood zone.
- NEAR_DIST – if the point is not in a flood zone, the distance, in meters, to the nearest flood zone. Blank if the point is within a mapped flood zone.
- NEAR_STATIC_BFE – if the point is not in a flood zone, the nearest static BFE, in feet NAVD88. Blank if the point is within a mapped flood zone.
- SEAWARD_HAB – description of the seaward shoreline habitat type from NOAA ESI data – only for Kittery to western Phippsburg, not available for the rest of the coast.
- DUNE – description of the dune type the point is located within, either 0, 1 or 2.
- HAT_CONTACT – whether the structure contacts HAT, Y or N – only for Kittery to western Phippsburg, not available for the rest of the coast.
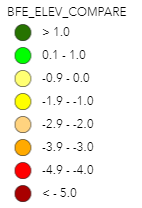
Dune Points – point file representing points (approximately 5-meter spacing) along the digitized dune crest line where elevations were extracted from available LiDAR data and compared with available FEMA 100-year BFE values. The data is symbolized by color-coded circles which represent the relationship between the dune crest elevation and the FEMA BFE. Yellow to red colors indicate that the dune crest is below the FEMA BFE, while light to dark shades of green indicate that the dune crest is at or above the FEMA BFE. Coloring and scaling is as follows:
If you click on an individual structure point, attributes include:
- DUNE – description of the dune type the point is located within, either 0, 1 or 2.
- Dune_Elev_ft – the elevation, in feet NAVD88, of the dune crest from LIDAR.
- FLD_ZONE – the mapped FEMA flood zone in which the point falls, either A, AE, AO, VE, or OPEN WATER.
- STATIC_BFE – the effective FEMA base flood elevation referenced to feet, NAVD88; if no published value, -9999 is used.
- BFE_ELEV_COMPARE – comparison between BFE and the shoreline engineering structure’s approximate crest elevation. A negative value indicates the structure is below the BFE.
- NEAR_FLD_ZONE – if the point is not in a flood zone, the nearest flood zone to the point. Blank if the point is within a mapped flood zone.
- NEAR_DIST – if the point is not in a flood zone, the distance, in meters, to the nearest flood zone. Blank if the point is within a mapped flood zone.
- NEAR_STATIC_BFE – if the point is not in a flood zone, the nearest static BFE, in feet NAVD88. Blank if the point is within a mapped flood zone.
Coastal Elevations (m) – raster file depicting color-coded (blue to green, low to high) land-surface elevations from the 0 m NAVD contour up to the 10 m NAVD contour. LiDAR elevations are included so that users of the Viewer can inspect whether elevations landward of a shoreline engineering structure or dune crest get higher, stays about the same, or get lower in topography. This helps users investigate the elevations of their infrastructure (homes, etc.) in reference to the structure or dune crest and the relationship with the FEMA Base Flood Elevation (BFE).
Q3. What datasets were used to compile this information? Back
Several different data sources were used to compile this dataset, including:
- NOAA Environmental Sensitivity Index (ESI) Office of Response and Restoration GIS data layers representing different shoreline engineering structures and habitat types.
- Available Maine DEP GIS-data relating to issued permits for seawall construction or reconstruction in Maine.
- Available aerial orthoimagery from Nearmap, VEXCEL and the Maine GeoLibrary.
- Shoreline engineering structures from work by Rice (2015) which mapped hard stabilization structures in support of beach habitat mapping.
- MGS Highest Astronomical Tide (HAT) layer.
- Available LiDAR topographic data. For York, Cumberland, and part of Sagadahoc counties, data included 2006, 2010, 2013, and 2014; for the remaining counties, LiDAR was from 2022 and 2023. Data is accessible from NOAA’s Data Access Viewer;
- Mapped boundaries of the coastal sand dune system from Coastal Sand Dune Geology Maps
- FEMA Digital Flood Insurance Rate Map (DFIRM) GIS layers from the FEMA Map Service Center and the National Flood Hazard Layer database.
- Maine DEP Head of Tide data points were used as the salinity tidal boundary up to which engineering structures were digitized.
Q4. Are there any quick data summaries you can share? Back
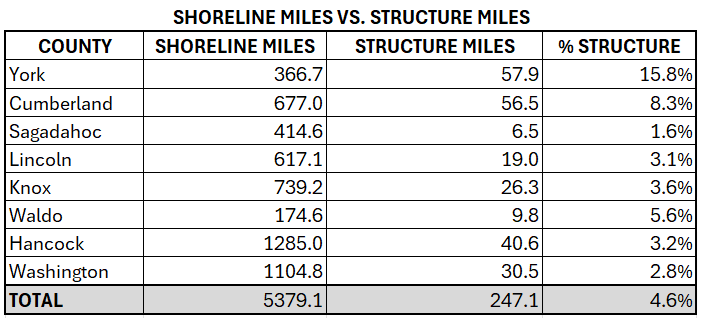
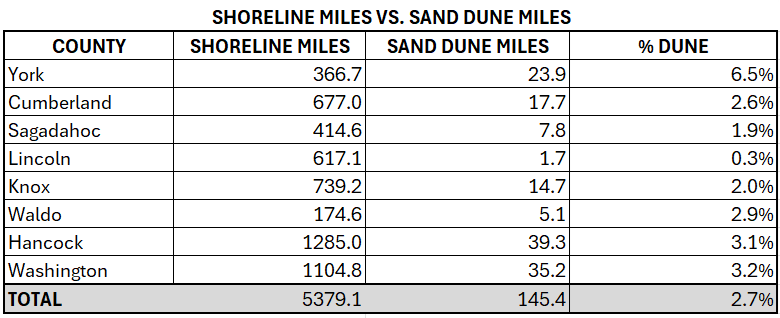
Based on the highest astronomical tide, there are approximately 5,379 miles of tidally influenced shoreline along coastal Maine. Based on current mapping, coastal engineering structures front 247.1 miles – or about 4.6% - of Maine’s overall shoreline. Undeveloped dune crests front approximately 145.4 miles – or about 2.7% of the shoreline.
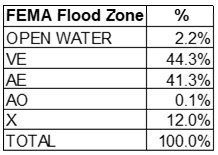
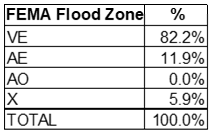
Most engineering structures along the coast – over 50% - are located within the FEMA VE (Velocity with defined elevation) Zone, as shown in Table 1, with about 33% within mapped FEMA AE zones. Almost 15% are within the FEMA X zone.
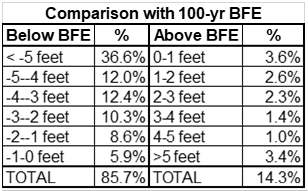
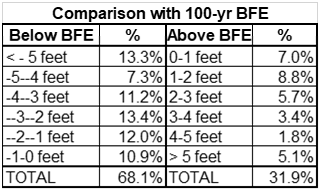
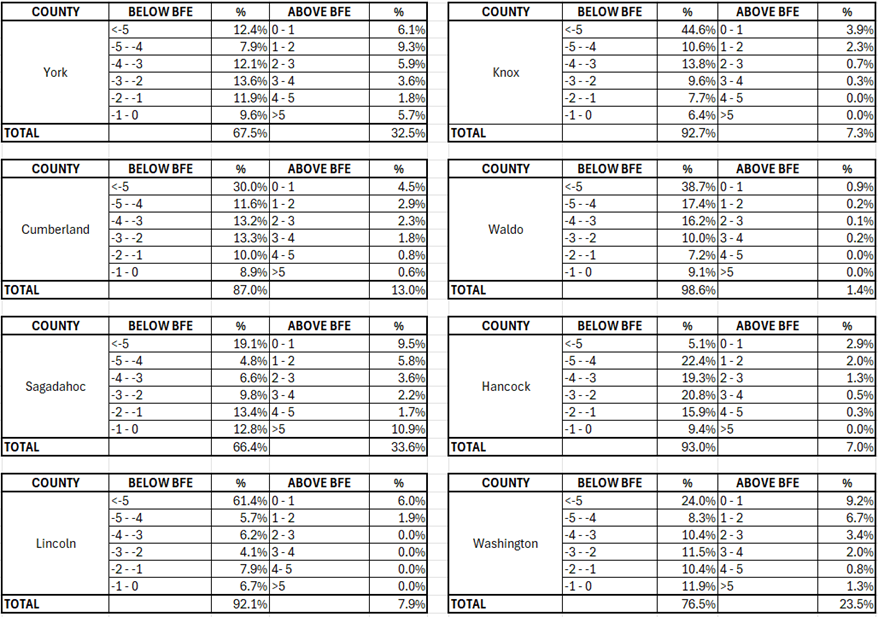
A large majority (about 82%) of coastal engineering structures are at or below FEMA BFEs, with only about 18% above the 100-year BFE. Most (about 44%) are 4 feet or more below the FEMA BFE. Only about 13% of existing structures are at least 1 foot above the BFE. See Table 2. A complete breakdown of coastal engineering structure statistics for each coastal county is displayed in the next section.
Coastal Sand Dune Crests vs. FEMA 100-year BFEs
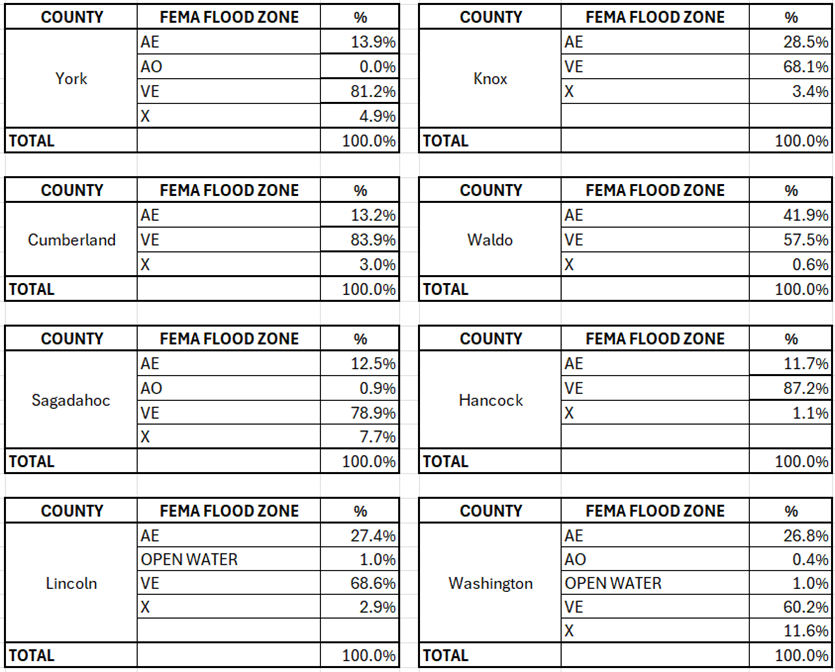
Similar to coastal engineering structures, most protective sand dunes – 76% - are located within mapped FEMA VE-zones, with almost 19% in FEMA AE-zones. See Table 3.
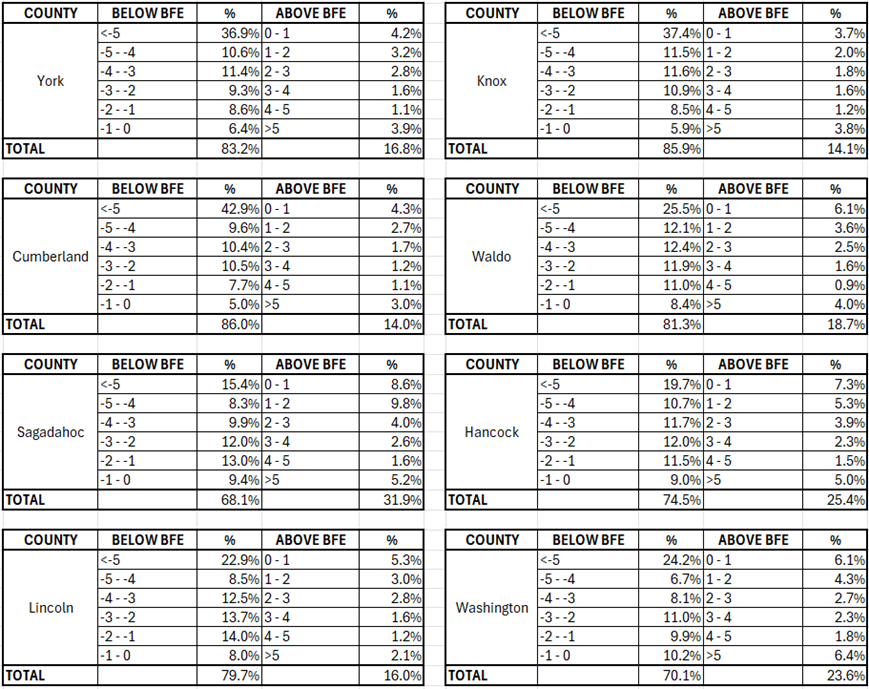
Most (almost 83%) of dune crests are below preliminary FEMA BFEs, with about 17% above the 100-year BFE. Only about 12% of current dune crests are at the recommended level of 1 foot or more above the BFE. See Table 4. A complete breakdown of dune crest statistics for each coastal county is displayed in the next section.
Data indicates that most of Maine’s coastline fronted by either shoreline engineering structures or coastal sand dunes is not of an adequate elevation to withstand overtopping associated with a 100-year storm event.
Q5. I’d like to see how my county is represented in this data. Could you break down statistics by county? Back
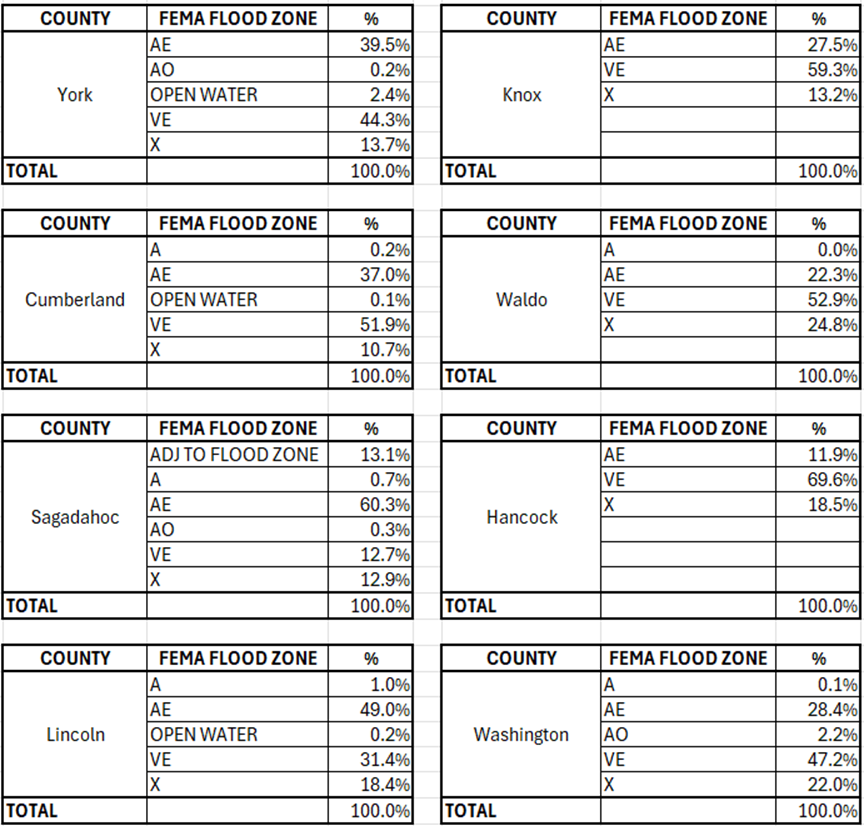
Tables 5 to 10 summarize the miles of shoreline in each county fronted by mapped engineering structures and mapped sand dunes, and the relationship between engineering structure and sand dune crests and the effective FEMA base flood elevations. Engineering structure summaries are presented first (Tables 5-7) and then coastal sand dunes (Tables 8-10).
Shoreline Miles vs. Structure Miles by County
Coastal Engineering Structures in FEMA Flood Zones by County
Coastal Engineering Structures vs. FEMA 100-year BFEs by County
Shoreline Miles vs. Sand Dune Miles by County
Coastal Sand Dune Crests in FEMA Flood Zones by County
Coastal Sand Dune Crests vs. FEMA 100-year BFEs by County
References
Rice, T., 2015. Beach Armor, 2012-2015, North and Mid-Atlantic, U.S., Terwilliger Consulting, https://www.sciencebase.gov/catalog/item/5b8561c1e4b05f6e321d03e7
Slovinsky, P.A., and Dickson, S.M. 2011. Coastal Sand Dune Geology 1:4800 scale Online Maps. Maine Geological Survey. Augusta, ME. https://www.maine.gov/dacf/mgs/pubs/online/dunes/dunes.htm
Last updated on February 27, 2020